Recallibration
from nomspectra.spectrum import Spectrum
from nomspectra.recal import ErrorTable, recallibrate
import nomspectra.draw as draw
import pandas as pd
import matplotlib.pyplot as plt
Load spectrum and remove noise
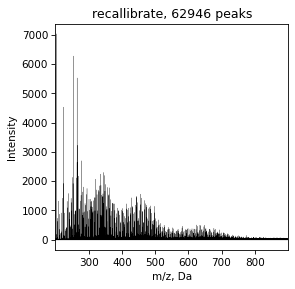
spec = Spectrum.read_csv(filename="data/recallibrate.txt",
mapper={'m/z':'mass', 'Intensity':'intensity'},
take_columns=['mass','intensity'],
sep='\t'
)
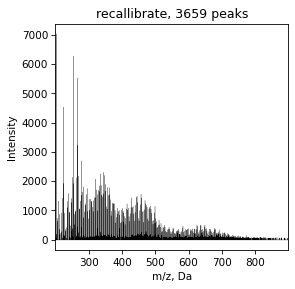
draw.spectrum(spec)
draw.spectrum(spec, ylim=(0,500), title='zoom in')
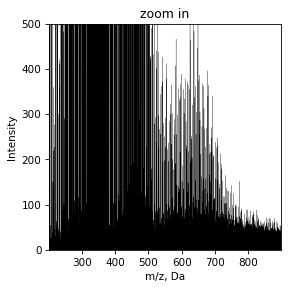
It can be seen that there is a lot of noise in the spectrum at an intensity level of 50-100. You can remove it using the noise_filter method with different settings - automatically with default settings, automatic with force control, by intensity and by the signal quartel that we want to drop.
spec = spec.noise_filter(intensity=50)
draw.spectrum(spec)
Try to assign witout recallibration
spec = spec.assign()
draw.vk(spec)
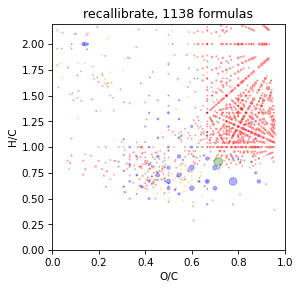
It is look bad and we should recallibrate spectrum before assign
Recallibrate by etalon sample
We can use extarnal etalon spectrum or calculated standart
spec = Spectrum.read_csv(filename="data/recallibrate.txt",
                            mapper={'m/z':'mass', 'Intensity':'intensity'},
                            take_columns=['mass','intensity'],
                            sep='\t',
                            intens_min=50
                            ).noise_filter(intensity=50)

spec = spec.assign()
spec = recallibrate(spec, how='data/etalon.txt')
spec = spec.assign()
draw.vk(spec)

It is looking better
Self-recallibrate by assign error
spec = Spectrum.read_csv(filename="data/recallibrate.txt",
                            mapper={'m/z':'mass', 'Intensity':'intensity'},
                            take_columns=['mass','intensity'],
                            sep='\t'
                            ).noise_filter(intensity=50)

spec = recallibrate(spec)
spec = spec.assign()
draw.vk(spec)
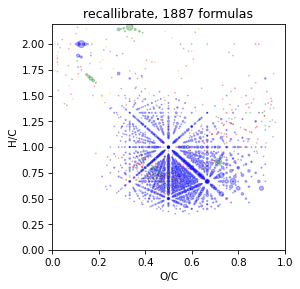
It is also good
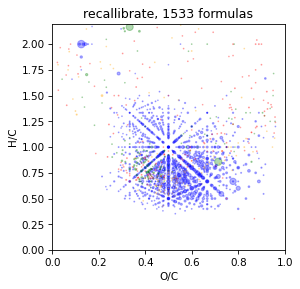
Recallibrate by mass difference map
It is base on calculation difference in mass bitween all signals. Usually, the occurring differences are discrete due to frequently occurring fragments, eg CH2. If the average mass of a given fragment differs, then the spectrum can be recalibrated on this basis. Before apply spectrum must be assigned
Read more in the article: Smirnov, K. S., Forcisi, S., Moritz, F., Lucio, M., & Schmitt-Kopplin, P. (2019). Mass difference maps and their application for the recalibration of mass spectrometric data in nontargeted metabolomics. Analytical chemistry, 91(5), 3350-3358.
spec = Spectrum.read_csv(filename="data/recallibrate.txt",
                            mapper={'m/z':'mass', 'Intensity':'intensity'},
                            take_columns=['mass','intensity'],
                            sep='\t'
                            ).noise_filter(intensity=50)
spec = spec.assign()
spec = recallibrate(spec, how='mdm')
spec = spec.assign()
draw.vk(spec)
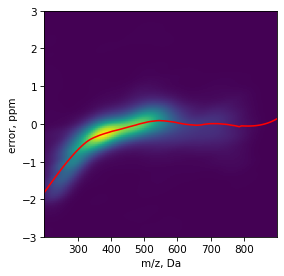
Manual recallibrate
Set error table or load it from file
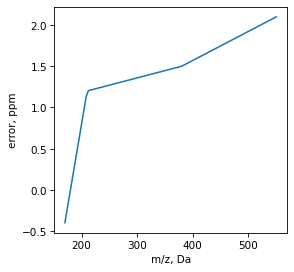
data = [[170, -0.4],
[210, 1.2],
[380, 1.5],
[550, 2.1]]
df = pd.DataFrame(data, columns=['mass','ppm'])
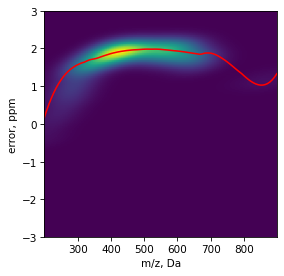
err = ErrorTable(df).extrapolate() #load and extraoplate data for all diapasone
err.show_error()
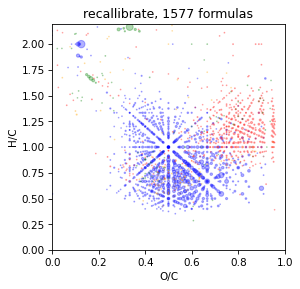
spec = Spectrum.read_csv(filename="data/recallibrate.txt",
mapper={'m/z':'mass', 'Intensity':'intensity'},
take_columns=['mass','intensity'],
sep='\t',
).noise_filter(intensity=50)
spec = recallibrate(spec, err)
spec = spec.assign()
draw.vk(spec)